Manufacturing lead time is the elapsed time needed to make an item, excluding the time spent buying incoming materials or components. Average manufacturing lead days run from 21.0 for the fastest businesses to 79.3 for the slowest, so a single promised date rarely describes the wait your customer will feel.
You have a factory note that says four weeks, a buyer asking for a firm ship date, and a seasonal drop that will not wait. The sewing line, the mold, or the assembly cell is not the thing eating the calendar. The job is sitting. A ticket waits for a finished spec. A batch waits for a changeover. A carton waits for someone to sign the inspection sheet.
That gap is what makes what is lead time in manufacturing a planning question, not a machine-speed question. The clock only means something once you name where it starts, where it stops, and which stages you chose to count.
Table of Contents
- What Manufacturing Lead Time Measures and Where the Clock Starts
- The Stages That Make Up Lead Time
- Measuring Lead Time From Order Timestamps
- Why Waiting Outweighs Processing in Factories
- Planning With Lead Time Ranges Instead of Averages
- Delay Symptoms and the Levers That Shorten Lead Time
- Map Your Lead Time Before You Cut It
What Manufacturing Lead Time Measures and Where the Clock Starts
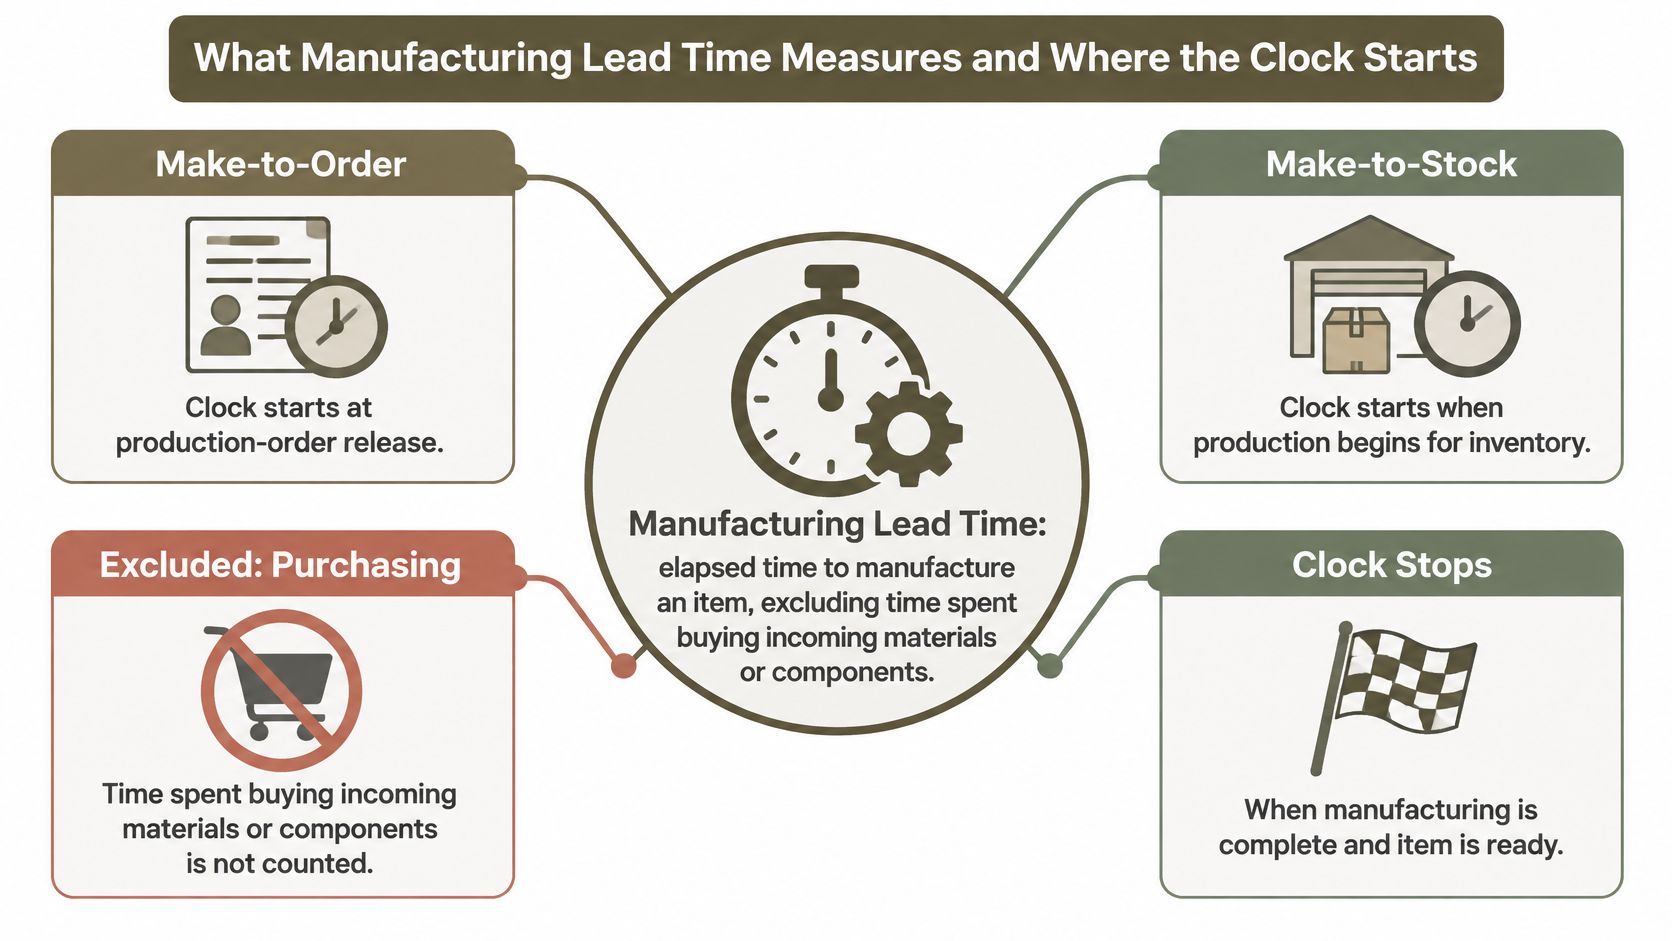
A standard production reference defines manufacturing lead time as the elapsed time required to manufacture an item, excluding the time needed to purchase incoming materials or component parts. For a make-to-order product, the clock usually starts when the production order is released and ends when the finished product is shipped to the customer. For a make-to-stock product, it ends when the completed item enters finished-goods inventory.
Think of a diner. The cook needs ten minutes at the grill. The guest still waits half an hour because the ticket sat in the rail, plating was late, and the server was on another table. The grill time was real. It was not the wait the guest experienced.
Lead time is not processing time or machine time. The same reference, echoing how NIST describes the measure, counts order preparation, queue or waiting time, machine setup, actual run time, movement between operations, inspection, and put-away. A product may spend only a small fraction of its total lead time being actively worked on. The rest disappears into queues, transfers, scheduling, and checks.
Three clocks that look alike
Order-to-ship, release-to-finished-inventory, and supplier-order-to-receipt are different metrics. Mixing them is how a clean factory number becomes a missed launch.
Each function already keeps its own clock. Procurement often measures requisition-to-receipt. Production often measures order entry-to-finished-goods shipment. Maintenance often measures alert-to-replacement-part arrival. A consumer-goods "factory lead time" may still exclude material purchasing, sample approval, revisions, freight, customs, receiving, or quality inspection, as a practical lead-time guide points out. A blended figure hides which of those stages moved.
Practical rule: A lead-time number is a time boundary plus the stages inside it. Without both, you cannot tell whether a shorter quote is real.
Cutting hands-on production time may not move the total at all if queueing, clarification, or approval delays dominate. Clearer factory-ready specifications can shorten clarification, setup, and rework, but only if those stages are on the report.
Report these stages separately instead of one blended figure.
- Concept and specification readiness: the days until the pack is complete enough to quote.
- Supplier response and sampling: the days until a maker answers and a sample exists.
- Approval and production: sign-off, then the factory clock itself.
- Logistics and receiving: freight, customs, and the dock.
Before you quote any figure, write three lines. Name the start point. Name the end point. Name the included stages. If purchasing is outside the clock, say so in the same sentence as the number.
The Stages That Make Up Lead Time
A foundational production-engineering model, set out in a Brunel University study of manufacturing lead time, writes manufacturing lead time as setup time plus processing time plus non-operation time. Non-operation time is the waiting, the movement, and the related delays. That is the whole factory clock in one line.
Production lead time is wider. It can include design, manufacturing planning, manufacturing control, and only then the manufacturing stage. In the production context that study examined, manufacturing lead time represented 94% of the broader product lead-time duration. Factory elapsed time can dominate the customer timeline even when design and planning are counted on their own.
Toyota's production-system history, recorded in that same literature, shows the lever is often the plan, not the press. Changing from monthly production planning to a 10-day planning cycle reduced the average period from order receipt to vehicle delivery from 50 days to 25 days, a 50% reduction. A later system that allowed daily adjustments shortened delivery lead time to 10 days. Scheduling frequency, information flow, inspection, and the ability to change the plan close to completion all sit inside the number.
Map one order onto the stages
| Stage | What happens | Counts toward lead time | Where delay usually hides |
|---|---|---|---|
| Material purchasing | Buying incoming components | No, excluded by definition | Supplier lead time, tracked separately |
| Order preparation | Routing, paperwork and approvals | Yes | Waiting for complete specifications or sign-off |
| Queue or waiting | Job sits before a workstation | Yes | Busy machines and batch-building |
| Machine setup | Equipment changed over for this job | Yes | Frequent changeovers and small batches |
| Run or processing time | Value-adding work on the item | Yes | Often the smallest share of total time |
| Movement between operations | Transfer to the next station or site | Yes | Shared transport and handoffs |
| Inspection | Quality checks and approvals | Yes | Rework loops and late revisions |
| Put-away | Stocking finished goods | Yes, for make-to-stock only | Receiving backlogs |
Material purchasing is on the sheet so you can see it, then leave it out. Supplier lead time is its own metric. Run time is often the smallest share, which is why the next measurement hunt is for waiting, not for a faster spindle.
Take one real order and drop each day into a row. The row with the most days is the first place to investigate. Teams that already separate those handoffs inside supply chain management stop arguing about a blended week and start arguing about a named stage.
Measuring Lead Time From Order Timestamps
You cannot manage a stage you never stamped. Record four times on every order. Release. First machine start. Last operation complete. Shipment, or put-away into finished-goods inventory for a stocked item.
Subtract release from shipment. That difference is total elapsed time. If your definition excludes purchasing, pull any supplier-hold days out of that span before you publish the factory figure.
Use calendar days when customers quote calendar days. Use working days when the plant runs a fixed shift calendar. Never mix the two in one report. A Friday release and a Monday start is three calendar days and zero working days, and both answers are honest only if the label matches.
Say an order is released on 3 March and ships on 24 March. That is 21 calendar days. If 6 of those days were a supplier hold outside the factory clock, the factory lead time is 15 days. Write both numbers, with the exclusion named, or the next person will treat 21 as the cell time.
One order is an anecdote. Pull the last 20 to 30 completed orders in each product family. Report the median and the 90th percentile, not the average. A few stalled jobs drag the mean up and make a typical order look worse than it is.
Tag every order with the stage where it waited longest, using the rows above. Then compare queue time by work center. The work center with the largest queue is your bottleneck, even if its machines look busy and "efficient." Repeat the same stamps after each change so the new median can be set against that baseline.
Why Waiting Outweighs Processing in Factories
The dominant driver is often the line in front of the machine, not the cycle on the machine. Queueing-based manufacturing research defines manufacturing lead time as setup and processing time across the routing, plus waiting in front of each workstation. Queue delays grow as arrival rates approach processing capacity.
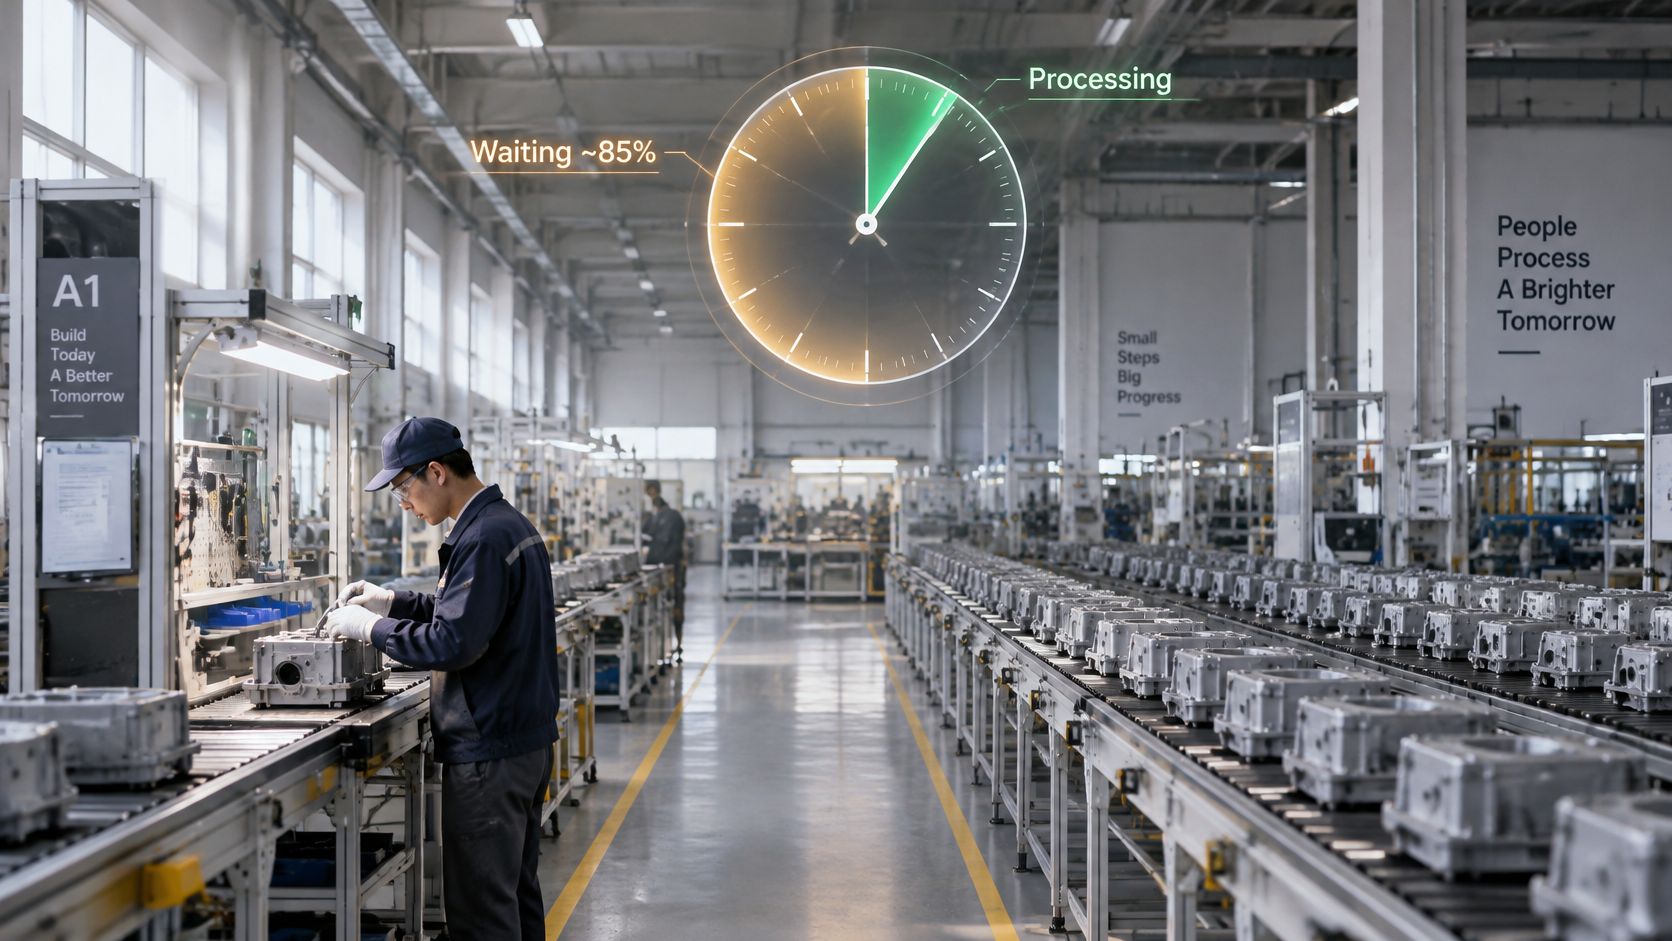
Published findings cited in the operations literature on manufacturing lead time report that approximately 85% of total manufacturing lead time can arise from queueing in some systems, while other research reports 95 to 99% of production time spent waiting in queues. Those figures are context-dependent. They are not a universal benchmark, and your plant may sit well below them. They still explain why a faster cycle time can leave the customer date untouched.
Picture a highway. At moderate traffic, one extra car barely matters. Near full capacity, one extra car turns a smooth lane into a crawl. Factories behave the same way when demand varies and jobs differ in routing, setup, and batch size. High utilization creates disproportionately large queues.
Split the earlier non-operation bucket so you can act on it.
Lead time = processing time + setup time + queue time + movement and inspection time.
What to do with the stamps
- Measure each component by work center, using release, first start, last complete, and ship.
- Find the bottleneck with the largest queue, not the machine with the highest utilization badge.
- Cap work-in-progress entering that resource so new jobs stop stacking in front of it.
- Reduce setup and batch-size variability so the queue does not rebuild every changeover.
- Sequence jobs to minimize changeovers, grouping like work without letting a due date rot behind a convenient batch.
A shared, version-controlled specification can cut the waiting that comes from missing information and from rework. It does not replace a WIP cap. Capacity planning and those controls still decide whether bulk dates stay predictable.
Running every machine harder can make the plant look efficient while orders wait longer. Utilization without a handle on variability is how delivery gets worse.
Planning With Lead Time Ranges Instead of Averages
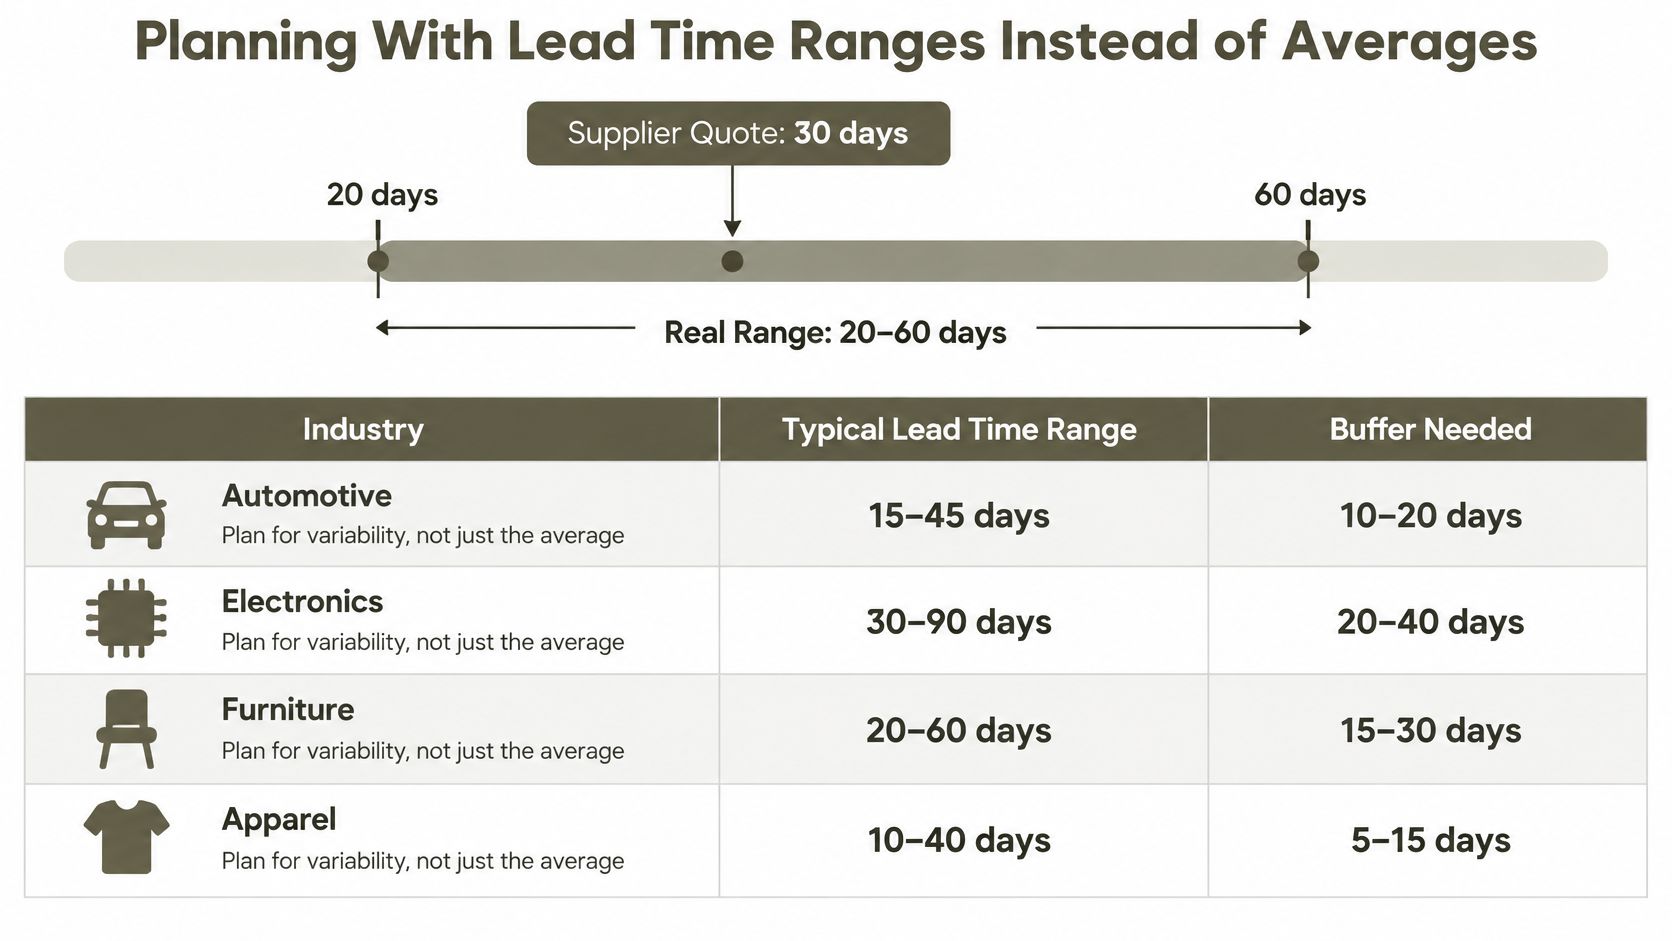
A supplier quotes a nominal 30-day lead time. Actual outcomes land anywhere from 20 to 60 days. That quote is commercially unusable without a buffer, because the promise and the bad week are not the same number.
A 2026 supply-chain benchmark reported average manufacturing lead days ranging from 21.0 days for the fastest-performing businesses to 79.3 days for the slowest, while Europe and UK manufacturing stragglers reached about 113 days. The same survey described overseas shipments that previously took two weeks stretching to six weeks. The operational problem is often variance, not merely duration.
Materials and capital sit on even longer clocks, and they should not be folded into the factory figure.
| Benchmark | Figure | Period | What it tells planners |
|---|---|---|---|
| Fastest-performing businesses, average manufacturing lead days | 21.0 days | 2026 benchmark | The achievable floor for a well-run operation |
| Slowest-performing businesses, average manufacturing lead days | 79.3 days | 2026 benchmark | Shows how far the spread can reach |
| Europe and UK manufacturing stragglers | About 113 days | 2026 benchmark | Regional gaps can dominate the plan |
| Average lead time for production materials | 79 days | April 2024, Deloitte | Material sourcing can outweigh factory time |
| Average commitment lead time for capital expenditures | 175 days | June 2023, ISM | Capital equipment needs long planning horizons |
| Average commitment lead time for capital expenditures | 170 days | August 2023, ISM | Confirms that long horizons persisted |
| Average production-material lead time | 87 days | August 2023, same ISM report | Materials again the longest planning element |
Quoted, median, and worst case
Keep three figures apart. The quoted lead time is the date someone promised. The median is the typical outcome across recent orders. The worst case is the buffer you really plan with, often near that 90th percentile.
- Ask for a percentile or a range, not a single date.
- Name the stage that creates most of the spread, using the stamps you already collect.
- Track first-pass approval and revision counts, because late changes widen the range even when the machines do not slow down.
- Set the buffer from the worst case, not from the median, and say which one the customer date uses.
Compressing concept-to-specification work still helps when the factory and the boat do not get faster. Fewer late changes mean less of the range comes from surprises. Inside production planning, that range belongs next to the promise, not in a footnote after the miss.
Delay Symptoms and the Levers That Shorten Lead Time
The symptom you will see first is simple. Jobs wait days before any machine starts. That wait usually lives in order preparation, or in a queue at a bottleneck that was already full when the order was released.
| Symptom | Likely stage | Lever to pull |
|---|---|---|
| Orders wait days before any machine starts | Order preparation or queue at a bottleneck | Release jobs only when specs and materials are complete; cap WIP at the bottleneck |
| Quotes stretch and change after approval | Incomplete or inconsistent tech packs | Send one version-controlled spec with construction details and component breakdowns |
| Every batch needs a long changeover | Setup time and batch size | Group similar jobs and reduce changeover time |
| Samples come back for revision | Late design changes and approval loops | Lock first-pass specifications and count revisions per sample |
| Shipments late after production is done | Movement, inspection or logistics | Add inspection checkpoints earlier; confirm freight and receiving windows |
| Lead time varies from order to order | High utilization with variable demand | Plan buffers from the worst-case range, not the median |
Match the lever to the stage, or you will "fix" the wrong clock. A faster cycle time will not help a job that has not been released. A prettier routing will not help a sample that keeps coming back because the construction details changed after the factory started.
Machine health still matters once the job is on the resource. An OEE improvement playbook for engineers is a useful companion when changeovers and small stops, not missing paperwork, are the stage eating the days. Treat it as a shop-floor tool, not as a substitute for a complete spec.
Some levers show up on the next order. Sequencing similar jobs, releasing only complete work, and sending one controlled tech pack can move a queue within a week. Capacity additions and a new supplier qualification usually take a quarter, because the constraint is people, tools, or a qualification file, not a sort rule.
If samples keep looping, the lever is upstream of the line. Design for manufacturing work that locks construction and components before the first sample is how you cut revision counts instead of hoping the third sample finally matches.
Map Your Lead Time Before You Cut It
A lead time works like a commute. The driving takes minutes; the traffic lights decide the hour. Before you shorten anything, find out where your orders are waiting.
Start with the boundary, not with a target.
- Write the start point, the end point, and the stages included in your own lead time.
- Pull timestamps for the last 20 to 30 orders, and map one recent order onto the stage table.
- Mark the stage with the largest queue or the widest range.
- Pick one lever from the symptom table and test it on the next order only.
- Ask each supplier for a percentile range instead of a single date.
That last step matters more than it looks. A quoted six weeks tells you nothing about the tail. A 50th and 90th percentile tells you how often the supplier hits the date and how bad the misses get when they miss.
For product teams whose specs still travel by email and whose samples sit in review, the specification and quoting stages act like their own clocks. Genpire sends the customer's tech pack as a request for quotation to vetted prototype manufacturers, and quotes come back in 24 to 48 hours. The same workflow shows real-time status: tech pack drafted, RFQ sent, quote received, sample ordered, sample approved, bulk in production, shipped. Manufacturing experts review each design for feasibility before production starts. Total time-to-shelf runs 9 to 13 weeks for most products.
Record the baseline before you change anything. A shorter promise you cannot compare with last month's median is just a new blended number.
If your dates keep slipping because specs, quotes, and samples live in different inboxes, Genpire holds that path in one workflow, from a factory-ready tech pack through quoting and into production status. Seeing each stage on its own clock is how you stop treating lead time as a single hopeful week. Visit Genpire and map the next product against a real start point, end point, and stage list.